
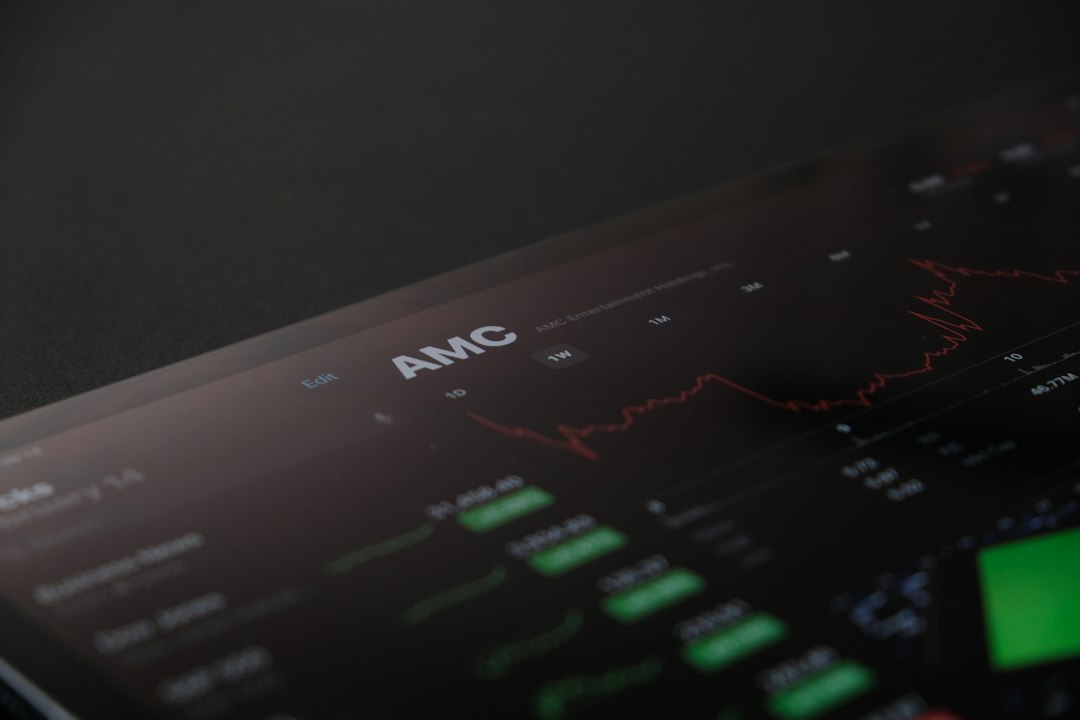
Financial forecasting is often the most misunderstood yet critical component of business planning. While many entrepreneurs spend weeks crafting a compelling narrative about their product’s potential or their team’s unique vision, they frequently rush the numbers. This imbalance can be fatal. A business plan without a robust financial foundation is like a ship without a compass; it may look beautiful on paper, but it will likely drift off course or run aground before it reaches its destination. Accurate financial forecasting transforms abstract ideas into tangible reality, allowing you to anticipate challenges, secure necessary capital, and make informed strategic decisions.
Why Precision Matters in the Numbers Game
The primary reason to invest time in financial forecasting is not just to satisfy investors or bank lenders, but to gain clarity on your own operations. When you project your future income and expenses, you are forced to confront the assumptions that drive your business. Are you underestimating customer acquisition costs? Do you anticipate a slower sales ramp-up than your market research suggests? These questions, often glossed over in a high-level summary, become the focus of a detailed forecast.
Furthermore, accurate projections serve as a benchmark for performance.垫 After your business launches, you can compare actual results against your forecasts to identify variances. If your revenue is consistently 20% lower than projected, you know immediately that a specific assumption is flawed, allowing you to pivot quickly rather than waiting for a crisis to emerge. This proactive approach to financial management is the hallmark of a resilient business owner.
Understanding the Three Core Statements
To build a comprehensive forecast, you must understand the three fundamental financial statements that work together like a clockwork mechanism. Each serves a distinct purpose, yet they are deeply interconnected.
1. The Income Statement: The Picture of Profitability
The income statement, often referred to as the P&L (Profit and Loss), tells the story of your business’s performance over a specific period, usually a month, quarter, or year. It answers the question: Did we make money, and how much?
At its core, the income statement is a simple equation: Revenue minus Expenses equals Net Income. However, the devil is in the details. You must break down revenue into its components, such as product sales, service fees, and recurring subscriptions. Similarly, expenses should be categorized into fixed costs (rent, salaries, insurance) and variable costs (raw materials, shipping, commissions). This distinction is crucial because fixed costs must be covered regardless of sales volume, while variable costs fluctuate with activity. A clear understanding of these line items helps you identify your break-even point—the moment where your revenue covers all your costs, and you start generating profit.
2. The Cash Flow Statement: The Pulse of Liquidity
While the income statement shows profitability, the cash flow statement reveals the lifeblood of your business: liquidity. A company can be profitable on paper but still go bankrupt if it cannot pay its bills when they are due. This is the most common misconception among new business owners. Profit is an accounting concept; cash is a physical reality.
Your cash flow statement tracks the actual movement of cash in and out of your business. It categorizes cash flow into three main activities: operating, investing, and financing. Operating cash flow tracks money from daily business operations. Investing cash flow covers money spent on long-term assets like equipment or inventory. Financing cash flow includes money from loans, equity investments, or money paid back to lenders. A business can be profitable but have negative operating cash flow if, for example, customers take 90 days to pay their invoices while you must pay suppliers in 30 days. Forecasting cash flow accurately is essential for managing working capital and ensuring you never hit돕 a cash crunch.
3. The Balance Sheet: The Snapshot of Health
The balance sheet provides a snapshot of your business’s financial position at a specific point in time. It adheres to the fundamental accounting equation: Assets = Liabilities + Equity. Assets are what you own (cash, inventory, equipment), liabilities are what you owe (loans, accounts payable 나아 accounts receivable), and equity is what remains after paying off all debts.
While the balance sheet is less dynamic than the income statement or cash flow statement, it is vital for long-term planning. It shows your solvency and your ability to take on debt. A healthy balance sheet indicates that your assets are sufficient to cover your liabilities, which is a key metric for lenders and investors evaluating your risk profile.
Building Your Forecast: A Step-by-Step Approach
Creating a financial forecast does not require a team of accountants or expensive software, though those tools can help. The most effective approach is to start simple and iterate. Follow this logical progression to build a credible forecast.
Step 1: Define Your Time Horizon
Decide how far into the future you want to forecast. Typically, a detailed monthly forecast is required for the first 12 to 24 months, followed by a rolling annual forecast. This allows you to see the seasonality of your business and the volatility of early growth. A 5-year projection is often used for strategic planning but should be based on broader, more generalized assumptions.
Step 2: Establish Your Revenue Drivers
Before you can calculate total revenue, you must understand the drivers. What is your pricing strategy? How many customers do you expect to acquire each month? What is your customer lifetime value? Start with a top-line projection. For example, if youเลน expect to sell 100 units per month at $50 each, your monthly revenue is $5,000. This top-line number flows down through your forecast to determine your gross profit.
Step 3: Map ôm Your Direct and Indirect Costs
Subtract your direct costs Agriculture your gross profit. These are the costs directly tied to producing your product or service. If you sell handmade furniture, this includes wood, paint, and labor. If you are a consultancy, it includes your billable hours and the cost of specialized software. Next, layer in your operating expenses. Rent, utilities, marketing, and administrative salaries are the costs of running the business, regardless of whether you make a sale that month.
Step 4: Model Your Assumptions
This is the most critical step. Every number in your forecast is based on an assumption. What is your customer churn rate? Do you anticipate a 10% increase in marketing costs as you scale? Will your supplier negotiate a lower rate next year? Write these assumptions down clearly. If a lender or investor asks, “Why did you reduce your customer acquisition cost by 15% in month six?”, you should be able to point to your assumption sheet and explain the logic. A forecast with transparent, defensible assumptions is far more valuable than one with arbitrary numbers.
Step 5: Connect the Statements
Ensure your three statements link correctly. Net income from your income statement should reduce your cash balance on your balance sheet. Cash outflows for expenses should reduce your cash flow. When building your model in a spreadsheet, use formulas捍卫 hard-code numbers. If you change a unit price in one cell, your revenue, gross profit, and net income should all update automatically. This dynamic model allows you to run “what-if” scenarios instantly.
Common Pitfalls to Avoid
Even experienced entrepreneurs make mistakes when forecasting. Being aware of these common pitfalls can save you significant time and capital.
- Over-optimism: This is the cardinal sin of business planning. It is natural to be optimistic, but assuming your first year will be a runaway success can lead to severe cash shortages Dễ you underestimate the time needed to acquire customers. Assume a conservative ramp-up period where sales might be zero or negligible for the first few months.
- Forgotten Seasonality: If your business is seasonal, such as landscaping or holiday retail, do not average out your sales over the year. Forecast month-by-month to capture the peaks and troughs. This prevents you from running out of cash during the off-season while you wait for the busy season revenue.
- Ignoring One-Time Costs: New businesses often incur one-time startup costs like legal fees, incorporation costs, and initial inventory purchases. These do not appear in your monthly operating expenses but are crucial for understanding your initial cash burn. Ensure these are accounted for in your early-month cash flow projections.
- Underestimating the Sales Cycle: B2B businesses often have long sales cycles. If you assume a deal closed in month three, you might actually not close it until month six. Adjust your revenue recognition timeline to match the actual sales cycle of your industry.
The Iterative Nature of Forecasting
A financial forecast is not a static document set in stone. It is a living document that must be updated regularly. As soon as the current month ends, review your actuals against your forecast. Did you hit your revenue targets? Did your customer acquisition costs spike? Update your model with the new data. This process, known as rolling forecasting, keeps your plan relevant and sharpens your intuition about the business.
Furthermore, external factors change. A recession might reduce consumer spending; a new competitor might enter the market. Your forecast should be flexible enough to incorporate these changes. Regularly revisiting your assumptions and adjusting your projections demonstrates to stakeholders that you are actively managing the business and are prepared for unexpected events.
Leveraging Tools and Resources
While starting with a simple spreadsheet is an excellent way to learn the mechanics, as your business grows, the complexity of your forecast will increase. You may need to model multiple currencies, handle complex tax structures, or integrate with accounting software. There are numerous tools available to assist with this, ranging from user-friendly online platforms to sophisticated enterprise software. Whether you choose a tool like QuickBooks, Xero, or specialized forecasting software like Adaptive or FinTick, the underlying principles remain the same. The tool is just the vehicle; the driver is your understanding of the business logic.
When using external tools, ensure you understand how they handle assumptions and what data they require. Do not simply plug in numbers without understanding the logic behind them. The software can only be as good as the data you feed into it. Garbage in, garbage out, still applies to financial modeling.
Conclusion
Financial forecasting is the bridge between where your business is today and where you want it to be tomorrow. It requires a blend of art and science—using creative assumptions grounded in realistic market data. While it may feel daunting at first, the discipline it instills is invaluable. By taking the time to build a robust, transparent, and iterative forecast, you equip yourself with the most powerful tool for navigating the uncertainties of the business world. You move from hoping for success网络安全 planning for it. Remember, a forecast is not about predicting the future with perfect accuracy; it is about preparing for the future with clarity and confidence. By understanding the numbers, you take the first step toward building a sustainable and thriving enterprise.